How accurate is an automated apartment valuation in Riga?
Several platforms in Latvia now offer instant apartment valuations, and there's one question people ask more than any other: where does this valuation actually come from? It's a fair question — there's no reason to trust a tool whose reasoning you can't follow. Which is why this article exists.
This article is based only on Riga data. We haven't forgotten the rest of Latvia — we cover it in full, but the results are a bit different there, and it deserves an article of its own.
Why this tool?
An apartment is one of the biggest purchases a person makes in their life. To get a sense of what it's actually worth, you can order a report from a professional valuer, which usually costs around €180–300.
Quick Evaluator offers a simpler way to get an independent read on a property's likely market value before an important decision.
We analyse real market transactions and the property's most important characteristics to estimate that value. And we show plainly how the result was reached — what data and factors shaped it.
That means you can decide based on data and facts, not just the asking price someone else wrote down.
A valuation you can't check is just an assertion. We want you to see every step that led to it.
How Quick Evaluator works
A perfect comparable transaction — this exact apartment, recently sold, its condition known — is almost never available in the real market. That's why Quick Evaluator doesn't use one universal formula: for each apartment, the system picks its approach based on what data actually exist for that specific property.
First, we identify the apartment in the state cadastre data and use an image model to assess the property's condition from photographs. Then we gather real comparable transactions, weighted by the assessed condition. We adjust each comparable transaction for the factors that matter most — time, floor area, condition, and a range of others.
What you get is not just a market value, but a confidence level and an explanation of how it was reached. A good valuation isn't just a number — it matters just as much to know how reliable it is and what data it rests on.
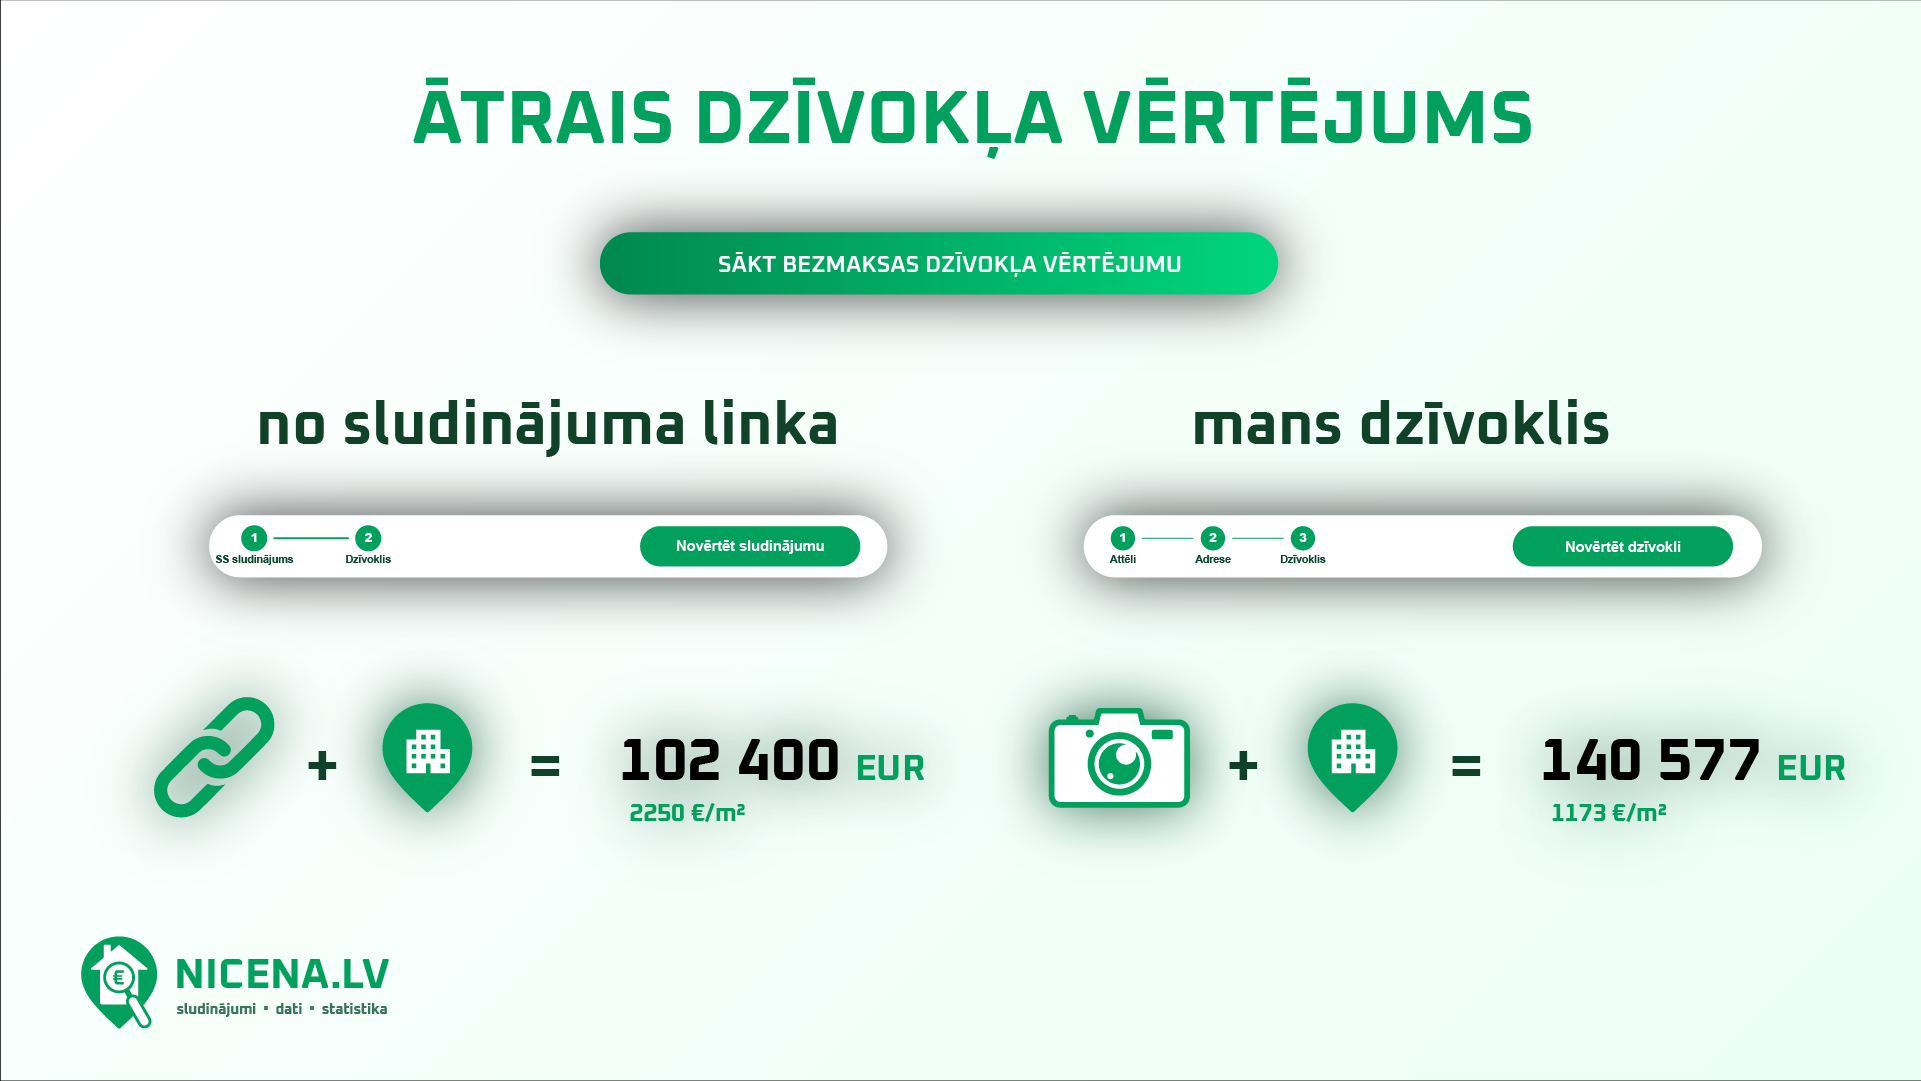
An example of a real valuation for a 45.5 m² two-room apartment in Riga. The range shown is an 80% confidence interval: in approximately eight cases out of ten, the actual price falls within it. The less evidence available for a specific apartment, the wider the range.
Accuracy depends on evidence
Not every apartment gets an equally accurate valuation. What decides it is how much we actually know about that specific property.
The method rests on many factors — floor area, floor level, location, transaction timing, and dozens of others. But one of them never shows up in any registry: condition.
That's exactly why we link real listings to the official transaction data recorded when a property sells. The listing gives us photographs — the property's condition. The registered transaction gives us the price. Together, that shows what sold and in what condition.
The cadastre knows the floor area, the room count, the building's year — not whether the kitchen was renovated two years ago or twenty. Condition is one of the biggest price drivers there is, and it's the one major factor the registry can't give us.
So accuracy comes down to how many linked transactions exist in the same building or nearby:
| Evidence tier | Average error | Median error | Share of valuations |
|---|---|---|---|
| Linked transactionswe can see what was sold and in what condition | 8.7% | 7.1% | 42% |
| Partially linkedsome transactions include photographs | 11.4% | 8.8% | 26% |
| Without linked transactionscondition estimated from nearby listings | 15.9% | 12.0% | 32% |
When evidence is thin, the tool shows a wider range and lower confidence rather than one falsely precise number — you always know what the number you're holding actually means. And every new listing on the platform makes the next valuation a little better.
How accurate is it today?
Measured: Riga, April 2025 – July 2026. Updated: 31 August 2026.
These figures reflect that measurement. The model and the data behind it keep growing, so current accuracy may differ — always check the update date.
11.7%
average absolute error in Riga versus actual transaction prices
8.7%
typical (median) error — half of valuations are more accurate
6%
of valuations miss by more than 30%
2,230
real transactions in the benchmark set
| Error band | ±5% | ±10% | ±15% | ±20% | ±30% | >30% |
|---|---|---|---|---|---|---|
| All valuations2,230 transactions | 31% | 56% | 73% | 84% | 94% | 6% |
| With linked transactionshighest evidence tier | 36% | 65% | 83% | 92% | 99% | 1% |
Overall bias +0.4% — the tool does not systematically lean high or low, and we detected no statistically significant bias in favour of lower- or higher-priced housing stock.
How we measure up against industry standards
In Europe, the reference point for AVMs is ESSVM — the European AVM Alliance's standards, which the European Banking Authority's guidelines also reference. They deliberately don't set an accuracy threshold; they set how accuracy has to be measured.
| ESSVM requirement | Us |
|---|---|
| Benchmark value — a confirmed transaction price; asking prices aren't allowed | VZD registered transaction prices |
| Tests must be blind and out-of-sample | Blind retrospective tests |
| The sample must be representative, not selected | Every linkable transaction in the period |
| Must report the share within ±10%, ±15%, ±20%, with case counts | We publish from ±5% to ±30% |
Valuation uniformity is measured against IAAO standards — these too are recommendations, not requirements, but they're the one widely accepted yardstick there is.
| Metric | Us | IAAO range |
|---|---|---|
| COD — how evenly valuations are spread | 11.9 | 5–15 |
| PRD — whether cheaper and pricier properties are valued equally | 1.01 | 0.98–1.03 |
| PRB — price-related bias | 0.00 | −0.05 to +0.05 |
| Median ratio to actual price | 0.987 | 0.90–1.10 |
What these figures measure. COD shows how evenly valuations are spread around the typical case. A low COD means the tool performs similarly well across the board — not brilliantly for some apartments and poorly for the rest. A high COD alongside a good average would mean the good and bad valuations are simply cancelling each other out.
PRD and PRB measure the same risk from two sides: whether cheaper apartments get systematically overvalued while pricier ones get undervalued. In mass appraisal that's a classic failure mode, which is why there are two separate metrics for it. Our PRB is close to zero and not statistically significant.
The median ratio to actual price shows whether the tool holds the right level overall. 0.987 means the typical valuation lands about 1.3% below the actual transaction price.
Why there's no comparison with other markets here. Published benchmarks exist worldwide. Oslo's apartment market has reached a median error around 5% in academic studies — measured across more than 160,000 transactions. The US mortgage industry uses roughly 70% of valuations landing within ±10% as a reference point. Germany, meanwhile, saw a study relying only on official registry data report a median error of 25-30%.
That spread alone shows why a direct comparison isn't possible: accuracy is shaped equally by the model and by how much clean transaction data a market actually has. In Latvia, no one publishes their error rate, so there's no local comparison either. Which is why what we show here measures our own work instead: whether valuations are uniform, free of systematic bias, and measured the way the standard actually prescribes.
How we measure accuracy
One way only: blind retrospective tests against prices actually recorded in the State Land Service transaction register. Not against opinions. Not against asking prices. When the tool produces its valuation, it has no access to the answer.
No change is introduced unless it improves results across the full benchmark set of 2,230 transactions. That rule is not a formality — in a single week in July 2026, the full test rejected three changes that had looked promising in initial checks. Hundreds of such tests have now been run, across different parameters and optimisations.
We test the displayed range as well as the estimate itself. When we measured that the true price was landing inside it in only 62.6% of cases, not the promised 80%, we widened the ranges. The valuations themselves didn't change — only how honestly we represent our uncertainty.
In July 2026 alone, that discipline moved our average error in Riga from 12.7% to 11.7% — a single month’s work, with every step of it documented and reproducible.
Where we stand against a certified valuer
Comparisons with other platforms are a separate topic — we'll give that its own article. Here we'll talk about the one comparison that actually matters: a certified valuer.
A certified valuer assesses one property, usually in person, with legal accountability and a report a bank will accept. We value thousands, in minutes, against a published error rate. These are two different jobs. We are not a replacement for a valuer — we are the step before one.
When you need a valuer. For a mortgage — the bank requires a certified valuer's report on the specific property. In a legal dispute where the value is contested. And for unique or atypical properties, where comparable transactions simply don't exist.
When we're enough. For a portfolio, an initial read, a sanity check before negotiating, tracking value over time.
Where we lose to a valuer. We don't inspect the property in person. The valuation rests on photographs and registry data — and assumes the uploaded images or video genuinely reflect the specific property.
We're more sensitive to evidence quality than a person is. With a linked comparable transaction and photographs, the median error is ~7.1%. Without that, relying only on registry data, it nearly doubles — ~12%. For a valuer, that drop is smaller. That gap shrinks over time — the more listings on the platform, the more valuations reach the highest evidence tier.
Atypical properties are a real risk zone. The model is built on comparable transactions. A property that's genuinely atypical for its building or segment can get a substantially wrong valuation — exactly where a valuer's judgment would catch it.
Where we have the edge. Floor, room size, how far back to pull transactions, how far to search for comparables, and dozens of other choices — each one tested, not assumed. Altogether, hundreds of "backtests" against 2,230 real transactions. A valuer doesn't have a control set like that.
What happens next
We're working on additional property data sources that will improve valuations across every evidence tier.
We're also widening the range of listing sources — the more listings with photographs, the more properties whose real condition we actually know.
For most people, an apartment is the most expensive purchase of their life. A purchase like that should be transparent and fair to everyone — and that's exactly what we're working toward.
Methodology
Every accuracy figure in this article comes from blind retrospective testing: the tool values a property without seeing the actual transaction price, and the result is then compared with the price recorded in the State Land Service transaction database.
The benchmark set is 2,230 Riga apartment transactions between April 2025 and July 2026 — every transaction from that period that we could reliably match to a specific listing on a real estate portal, with complete floor area and price data. Transactions we could not reliably match to a listing, such as sales agreed outside listing platforms, are not included. Mean absolute percentage error (MAPE) is the average percentage deviation of each valuation from the actual price; median error represents the typical case and is not pulled around by individual outliers.
Regional metrics are measured separately, on each city’s own transactions, because price dispersion in regional markets inherently differs from Riga. All of these figures are recalculated after every material change to the model.
Data sources and verification
NICENA.lv articles rely on publicly available Latvian real estate data and internally checked transaction comparisons.
Latvian Open Data Portal
Open data from the State Land Service real estate market database.
State Land Service / Kadastrs.lv
Cadastre information and property/object characteristics.
Land Register
Official verification of property rights and registered entries.
Real estate listing portals
Photos and descriptions published in publicly visible listings, linked back to registered transactions.
Dāvis Burmistris
Head of the Technical Department, NICENA
Quick Evaluator was built by the NICENA team — Voldemārs Baroniņš and Dāvis Burmistris.
Evaluate it yourself
Paste an address or a listing link — Quick Evaluator will show you the likely market value, with a full explanation of how it got there.